
This article is a detailed and complementary content to Quarkus Insights #107: Quarkus Runtime performance - a peek into JVM internals:
This episode treats a breed of issues caused by the scary (was registered at Halloween on purpose) JDK issue; "JDK-8180450: secondary_super_cache does not scale well" that can causes massive performance degradation on several middleware frameworks e.g. Netty, Vert-x, Mutiny, Hibernate, Quarkus…
What’s JDK-8180450?
For those who haven’t yet watched Quarkus Insights #107, JDK-8180450 is a severe scalability penalty happening while
performing type checks (instanceof, checkcast and similar) against interfaces (so-called secondary super types).
This scalability issue is triggered by massive concurrent updates to Klass::_secondary_super_cache
from multiple threads, which in turn causes False Sharing with its surrounding fields eg Klass::_secondary_supers.
This JDK 11 snippet shows both fields and what they are used for:
class Klass : public Metadata {
  // ...
  // Cache of last observed secondary supertype
  Klass*      _secondary_super_cache;
  // Array of all secondary supertypes
  Array<Klass*>* _secondary_supers;
  // ...
To make it more concrete:
Integer's implement bothComparableandSerializable_secondary_superscontains bothComparableandSerializable,_secondary_super_cacheis used by the JVM like this:The JVM does not need to search forObject o = new Integer(1); // _seconday_super_cache is empty // search Comparable on [ Comparable, Serializable ] if (o instanceof Comparable) { // _seconday_super_cache := Comparable -> cache HIT! useComparable((Comparable) o); }Comparablein the_secondary_supersarray when evaluatingcheckcastin theuseComparable, instead it can use the_secondary_super_cachefield, saving useless work.
So, What causes massive amounts of updates to the cache field?
The answer is simpler then it seems: making it ping-pong between multiple values contained in _secondary_supers!
The code below shows an example of this dangerous code pattern:
    // o.getClass() == Integer.class
    public static void compareAndSerialize(Object o) {
        if (o instanceof Comparable) {
            // _seconday_super_cache := Comparable
            useComparable((Comparable) o);
        }
        if (o instanceof Serializable) {
            // _seconday_super_cache := Serializable
            useSerializable((Serializable) o);
        }
}_secondary_super_cache
invalidations for every compareAndSerializable method execution, butWhat happens if there are more than one thread?
Integer::_secondary_super_cache is shared among all threads, leading to an increased chance to invalidate it at every type check (including checkcast 's on useComparable/useSerializable!).
Why’s that scary?
As mentioned on Quarkus Insights #107, the Red Hat Middleware Team uses different versions of
Techempower Benchmark to validate Quarkus's performance regressions.
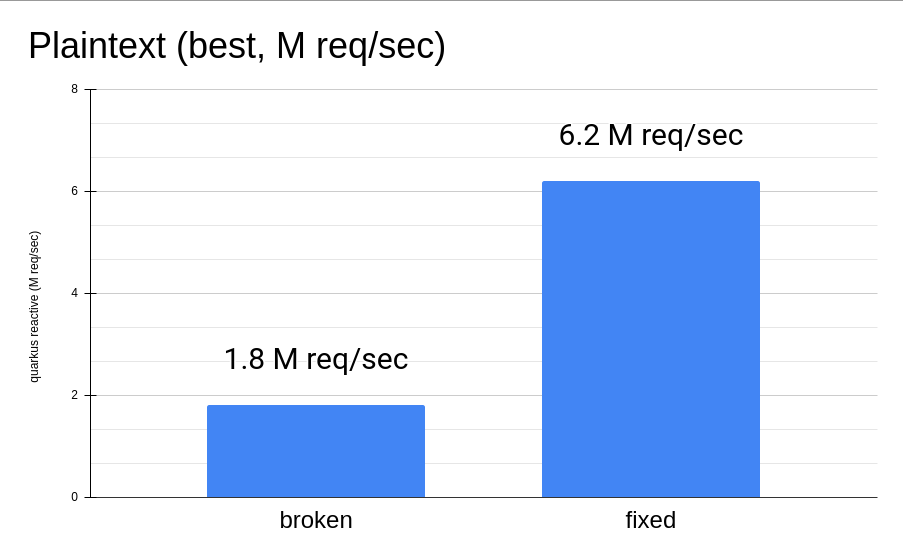
Hitting such scalability bottleneck in our lab has caused a performance degradation quite significant while running on our Intel® Xeon® Gold 5218 CPU with 64 logical cores (32 without Hyper-Threading, splitted in 2 NUMA nodes):
But what about running the same test with just 2 cores?
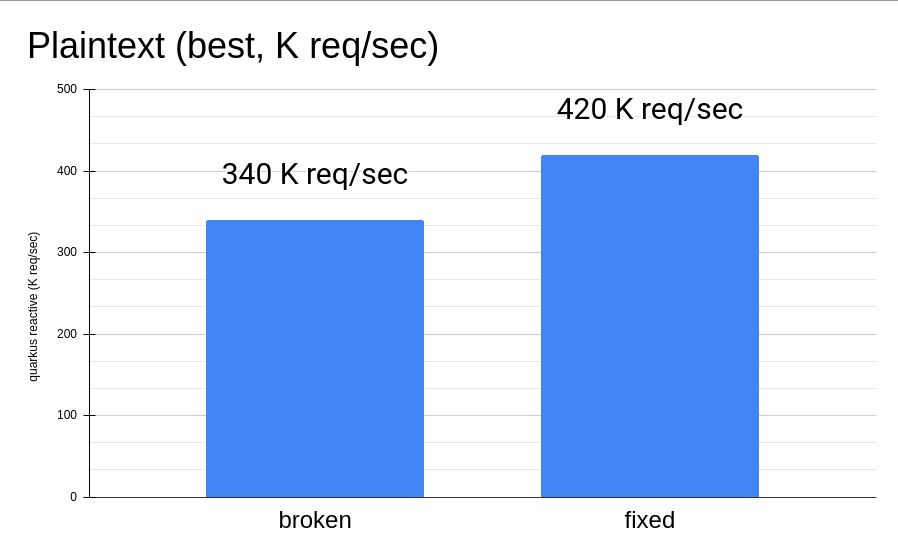
As shown, even with few cores, if the mentioned bad code pattern is hit in the hot path, the effects are still dramatic!
A stealthy performance killer!
The scariest part has yet to come: what we discovered while investigating the most severe case affecting our Quarkus results, is that "traditional" Java profiling tools didn’t seem to help diagnosing it (eg Java Flight Recorder, Async Profiler). Furthermore, a few weeks after the Quarkus Insights recording, Netflix has published an article highlighting the same problem while using traditional Java Profilers.
Specifically, Java Flight Recorder wasn’t reporting any guilty stack trace pointing to the source of the issue, while Async Profiler was reporting broken stack traces (with the right cost/samples count). In both cases the bad code pattern was unnoticed, although the latter provided some hint that something incorrect was occurring.
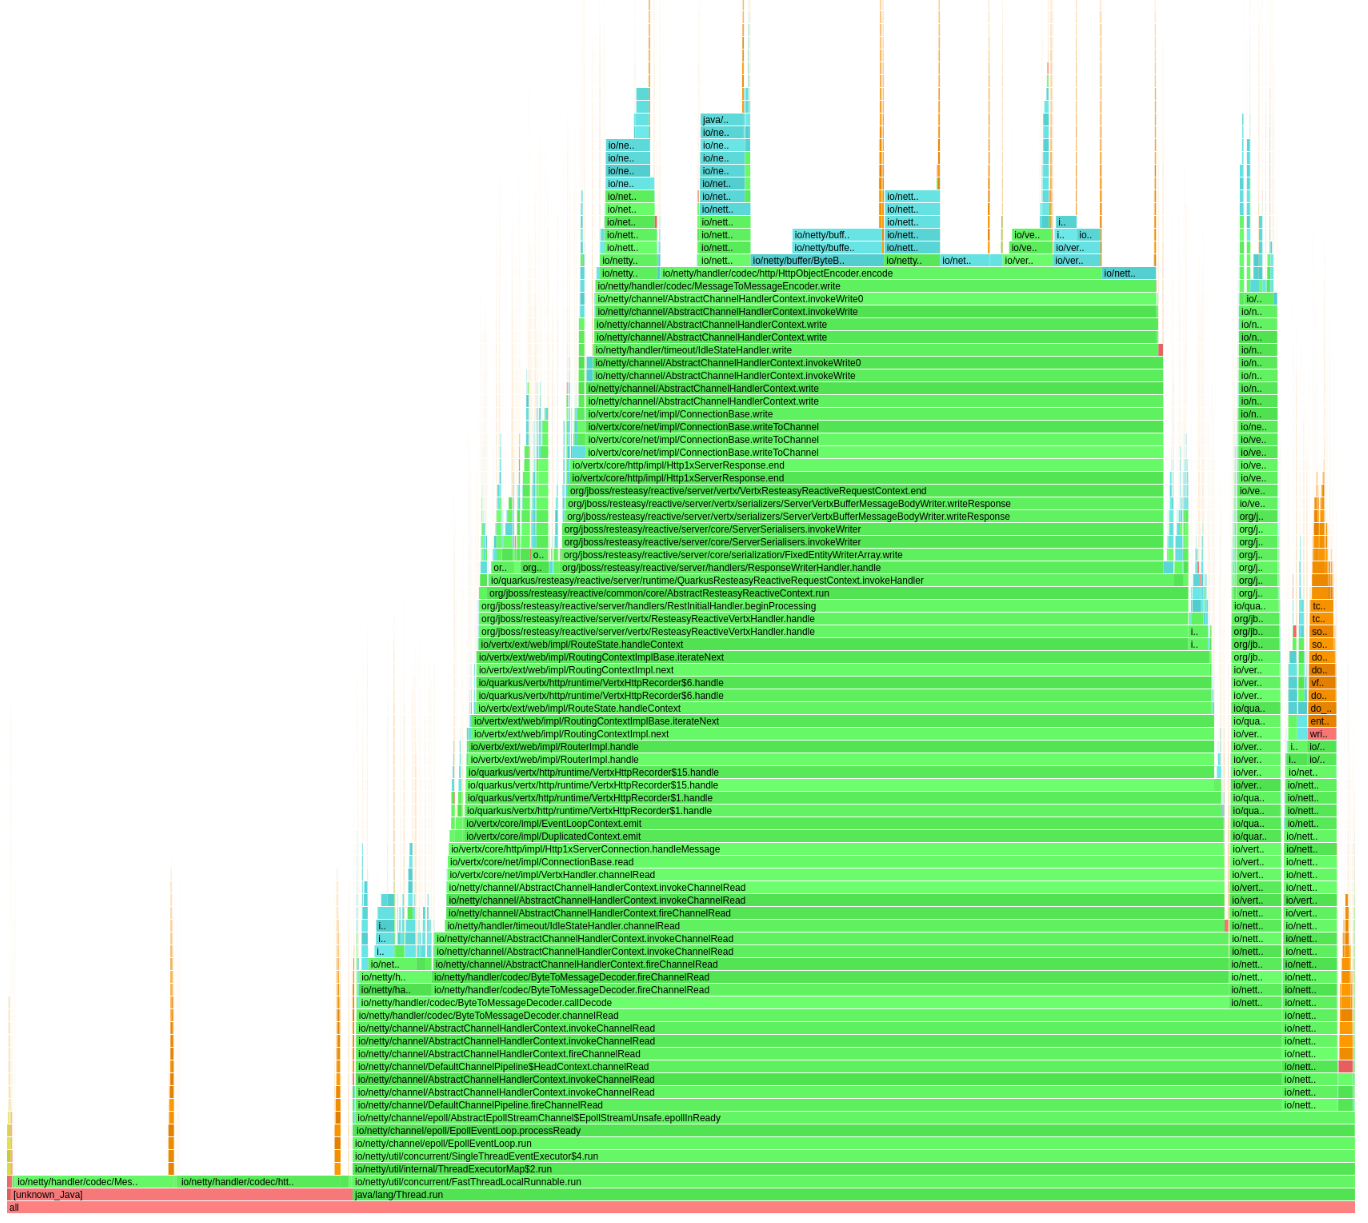
In the above flamegraph, the bottom left of the graph shows some costy methods, but failing to report the correct methods: not useful to fix it!
We’ve further investigated and discovered that the JFR mechanism to collect stack traces (implemented as AsyncGetCallTrace) isn’t able to collect meaningful ones. This is due to JDK’s type check code, which modifies the stack size and by consequence the x86 register used to track the Stack Pointer (more on this Async Profiler issue’s comment).
Thanks to this investigation, a recent JDK change fixing the mentioned behaviour
(which has been back-ported to JDK 11) ,
making this issue more easily spotted with existing (AsyncGetCallTrace-based) Java Profilers: a proper "Community Happy End".
…and False Sharing?
In addition to the above issue, False Sharing confuses profiling tools even further.
For every invalidation of Klass::_secondary_super_cache, a search over Klass::_secondary_supers is performed,
causing a severe penalty (if stored in the same cache-line of the "noisy" Klass field) and impacting other innocent code paths too:
    // o.getClass() == Integer.class
    // _secondary_super_cache always != CharSequence
    // slow path search on _secondary_supers := [ Comparable, Serializable ]
    if (o instanceof CharSequence) {
        // never happen
    } else {
        // always happen
}_secondary_supers. This in turn forces loading of the related field and causes
a ping-pong of cache coherency traffic. This has the effect of slowing down the innocent load instruction and causes a profiler
to highlight it as a cpu bottleneck.The issue is detailed in this Quarkus Insights part
OpenJDK compiler is (too) good
Some noticeable optimization strategies of OpenJDK are:
Thanks to both optimizations, the JDK Compiler can drop type-check operations preventing the issue from happening. Unlucky runtime conditions can then cause such optimizations to fail (as mentioned in this Quarkus Insights part), unexpectedly biting end-users.
This smart compiler behaviour, together with the previous mentioned profiler issues, has meant this issue has lay dormant and unnoticed for some time, especially in benchmarking environments, where overly simplistic use cases were leaving the compiler more room to optimize and hide it.
What’s next?
In order to support our developers and the Java Community to diagnose this stealthy and severe performance issue, we’ve developed a ByteBuddy-powered Java Agent. This has helped fix the most severe code paths of our products (and the widely used Netty Framework) and hopefully will be used by other players of the Java Community to diagnose if their code can be affected by it.
Thanks to the reports of our developers and the rest of Java Community (including Netflix and Intel engineers), the scalability JDK issue now has raised a priority and a fix will be targeted for the Java 21 release.
As a separate effort we’ve evaluated with the OpenJDK Red Hat team alternatives fixes to the infamous JDK issue as well, ending up rejecting ad-hoc flags to disable such optimization (as it was designed to be) because too harmful for existing users, which unconsciously have benefited from it till now. We are trusty that our feedbacks will help making a better decision for the Java Community, present and future.
Is it still worthy to fix our code?
As usual: Depends™.
As mentioned in Quarkus Insights, some fixes have helped to use different and more idiomatic code solutions to replace the misuse (often abuse) of the existing type check-based logic, often leading to better performance and, moreover, way better code.
In addition, there isn’t yet (at the time this article has been published) any mention of back-porting plans, meaning that legacy or just slow adopters (and existing users too) will be left behind, running code with suboptimal (at best) performance.
but I don’t know yet how to use the Agent!
In the next articles of our blog we’ll present more concrete examples of fixed code using the agent (presented on this Quarkus Insights part too) and the impact of the OpenJDK compiler optimization strategies (briefly mentioned here).
Special Thanks
Andrew Haley
Andrew Dinn
Rafael Winterhalter
Sanne Grinovero
Norman Maurer
Andrei Pangin
Johannes Bechberger
Quarkus, Hibernate, Vert-x, Mutiny and Infinispan teams for the patience and the efforts to try the agent and fix our products trusting our tools
Netflix & Intel team and their awesome article mentioned in this section