A community member ran our Quarkus vs Spring CRUD benchmark on their bare-metal Fedora workstation and asked:
Why do I see only 1.19x instead of 2x?
Our perf-lab shows Quarkus at 2.08x Spring’s throughput, but locally the gap nearly disappears.
This post walks through the investigation that found the culprit.
The gap
The benchmark is a REST/CRUD application backed by PostgreSQL. The app runs on the host, PostgreSQL in a rootless podman container. Each HTTP request executes 2 SQL queries (confirmed via pg_stat_statements).

Spring delivers roughly the same throughput in both environments. Quarkus swings from 15.5K to 24.5K TPS — it is being held back locally. Something in the local environment is capping Quarkus but not Spring.
mpstat: where is the CPU going?
The benchmark collects mpstat data during every run — per-CPU utilization split into %usr (application code), %sys (kernel), %soft (softirq, mainly network packet processing), and %idle. This is part of our active benchmarking practice: observing the system while it runs, not just collecting final TPS numbers.
Both environments run Quarkus at 2.3GHz with the same workload and CPU pinning. The mpstat profiles could not be more different:
| Environment | %usr | %sys | %soft | %idle |
|---|---|---|---|---|
Local (Fedora, 15,504 TPS) | 39-50% | 34-41% | 9-17% | 3-5% |
Perf-lab (RHEL, 24,472 TPS) | 87-94% | 5-11% | 0-2% | 0% |
%usr is time running application code. %sys is time in the kernel. On perf-lab, over 85% of CPU goes to the application. Locally, nearly half goes to the kernel. Same application, same clock speed, same workload: locally, a significant fraction of CPU time is spent in the kernel rather than in application code.
Where is the kernel time going?
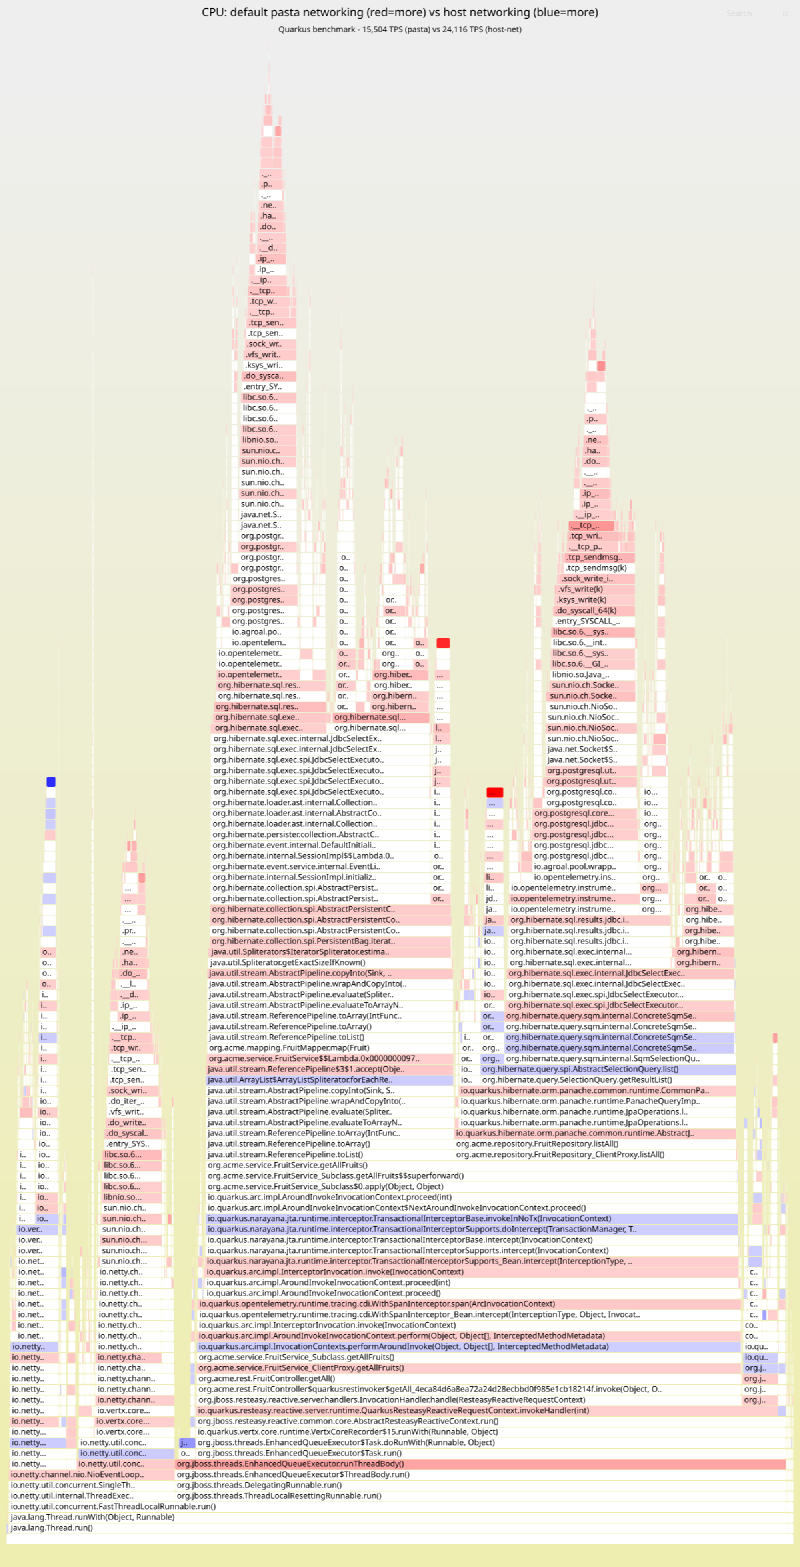
A differential flamegraph of the JFR CPU profiles (collected via async-profiler) from the perf-lab and local Quarkus runs shows exactly where the extra kernel time is spent:

Red frames appear more in the local run; blue frames appear more on the perf-lab. The brightest red hotspots are kernel spin locks (_raw_spin_unlock_irqrestore), nftables firewall evaluation (nft_do_chain, nft_meta_get_eval), and TCP packet processing (tcp_clean_rtx_queue, skb_defer_free_flush). The blue band at the bottom is application code that gets more CPU on the perf-lab — because the kernel isn’t eating it. The local kernel is spending cycles on network packet processing and firewall rules that the perf-lab doesn’t need.
The brightest red frame — _raw_spin_unlock_irqrestore — is worth a closer look. The stack trace shows it’s triggered by Agroal (Quarkus’s connection pool) returning a JDBC connection after a query: ConnectionPool.returnConnectionHandler → LinkedTransferQueue.tryTransfer → LockSupport.unpark → kernel futex_wake → try_to_wake_up → spin lock. If network round-trips are slower, JDBC connections are held longer and more threads pile up waiting for a free connection. Every connection return triggers a futex_wake to unpark a waiter — the higher the network latency, the more waiters accumulate, and the more kernel time is spent waking them.
The suspect: pasta, the userspace TCP proxy
Rootless podman on Fedora uses pasta (passt) to forward container ports. Unlike rootful podman (which uses kernel-level port forwarding), pasta is a userspace process that proxies every TCP packet:
With pasta (default rootless):
  App  -->  kernel  -->  pasta (userspace)  -->  kernel  -->  container netns  -->  PostgreSQL

With --network=host:
  App  -->  kernel  -->  PostgreSQL (same network namespace)
Every JDBC packet traverses two extra kernel/userspace boundary crossings plus a userspace copy in the pasta process. For a chatty protocol like JDBC with small, frequent packets, this adds up fast. The kernel functions visible in the flamegraph — nft_do_chain, tcp_clean_rtx_queue, skb_defer_free_flush — are not pasta’s own CPU time (pasta runs in a separate process), but they are the kernel-side cost of the extra network hops that the application’s syscalls now traverse. The connection pool contention (futex_wake from Agroal) could be a consequence of the added queuing delay: if each round-trip takes longer, connections are held longer, and waiters accumulate.
Crucially, pasta is single-threaded. It processes all forwarded packets on a single CPU core. If that core saturates, packet processing queues up — latency spikes and throughput hits a ceiling regardless of how many cores the application has available. The alternative is --network=host: the container shares the host’s network namespace, so packets stay in the kernel and never pass through a proxy.
Quantifying the overhead with pgbench
To measure pasta’s impact on database traffic, we ran pgbench with the same 2-query workload (50 clients — matching the default JDBC connection pool size for both Quarkus and Spring — prepared statements, 30 seconds) over different network paths. We also tested with Fedora’s nftables firewall disabled, since the flamegraph showed nft_do_chain in the kernel stacks:
| Network path | TPS |
|---|---|
Host → container (pasta + nftables) | 18,106 |
Host → container (pasta, no nftables) | 20,402 |
Host → container ( | 53,262 |
With --network=host, throughput jumps from 18K to 53K TPS — roughly a 3x increase. Pasta caps at ~18K TPS for this 2-query workload: that is the ceiling imposed by a single-threaded proxy.
The fix
Run the PostgreSQL container with --network=host instead of port-mapping (-p 5432:5432). We added DB_HOST_NETWORK=true to the benchmark’s infrastructure script.
| Configuration | Quarkus TPS | Spring TPS | Ratio |
|---|---|---|---|
Default (pasta + nftables) | 15,504 | 13,062 | 1.19x |
| 24,116 | 13,368 | 1.80x |
| 26,039 | 13,214 | 1.97x |
Perf-lab (RHEL 9.6, different hardware) | 24,472 | 11,783 | 2.08x |
With host networking, Quarkus throughput improves by 55% while Spring moves by +2.3%. Disabling the firewall on top recovers another 8% for Quarkus, bringing the ratio from 1.19x back to 1.97x — close to the perf-lab’s 2.08x.
Fedora’s firewalld loads nearly 1000 nftables rules that every packet traverses. This is independent of pasta — disabling the firewall adds another 13% throughput in the pgbench test (18,106 → 20,402 TPS).
Why Quarkus is affected but Spring is not
As the pgbench data shows, pasta caps at ~18,000 TPS for a 2-query workload. pgbench is a minimal client that does nothing between queries — it represents the maximum throughput pasta can forward. Quarkus, which also processes HTTP requests, runs ORM and serialization between SQL queries, reaches 15,504 TPS through pasta — lower than pgbench’s 18,106 because the application work between queries reduces the pressure on the proxy, but still constrained by it.
With host networking, Quarkus reaches ~24,000 TPS — well above what pasta can deliver. Spring reaches ~13,000 TPS, which is below pasta’s ceiling regardless of networking mode. Any application that can push close to pasta’s ceiling will be constrained by it; any application that stays well below it will not notice.
Confirming the fix
A second differential flamegraph — this time comparing the local default (pasta) run with the local --network=host run — confirms the overhead is gone:

Red means more CPU in the default (pasta) run; blue means more CPU with host networking. The red stacks that dominated the first flamegraph — _raw_spin_unlock_irqrestore, nft_do_chain, tcp_clean_rtx_queue — have disappeared.
With --network=host, the app and PostgreSQL share the same network namespace; packets never leave the kernel.
Takeaways
A benchmark that saturates an unexpected resource and component is not measuring what you think. This is what Brendan Gregg calls active benchmarking:
You benchmark A, but actually measure B, and conclude you’ve measured C.
— Brendan GreggWe benchmarked framework throughput, but Quarkus was saturating pasta’s single CPU core — so we were measuring pasta’s forwarding capacity, not framework performance. Only by collecting mpstat and flamegraphs during the run — as required by our benchmarking practice — did we identify which resource and component was saturated. Without that, the 1.19x ratio would have been taken at face value.
The impact is asymmetric. Pasta’s single-threaded ceiling affects only applications whose throughput would otherwise exceed it. In this benchmark, Quarkus exceeds the ceiling and is capped; Spring does not and is unaffected. The same logic applies to any workload — the proxy is invisible until you hit its limit.
Check your networking path. Run
podman info | grep rootlessNetworkCmdto see your backend. If it sayspastaand your benchmark talks to a containerized database, use--network=hostfor the database container.Firewall rules add up. Nearly 1000 nftables rules cost 8-13% throughput on this workload (8% for Quarkus with host networking, 13% for pgbench through pasta). For benchmarking, consider temporarily disabling the firewall or using a minimal ruleset.
Known upstream issues
Our findings are consistent with several known issues in the podman/pasta ecosystem:
pasta is single-threaded by design and degrades under concurrent load. Community reports confirm that above ~8 connections, even the older slirp4netns backend can outperform it. (Podman Discussion #22559)
pasta consuming 90-100% CPU has been reported under sustained network load, e.g. Wireguard tunnels on kernel 6.x. (Podman Issue #23686)
Java + PostgreSQL hang — a Spring app running PostgreSQL
COPY FROM STDINvia pasta consistently freezes mid-transfer.--network=hostfixes it. (Podman Issue #22593)Throughput far below host capacity — rootless containers on multi-gigabit hosts achieving only ~100 Mbit/s through pasta. (Podman Issue #17865)
Traffic stalls under sustained load — TCP downloads through pasta start normally then halt, with pasta pinned at high CPU. (Podman Issue #17703)
The official Podman performance tutorial documents
--network=hostand socket activation as workarounds for network-sensitive workloads.